
This piece was first published at Newsweek on July 24, 2024.
Climate Change Causing You Decision Fatigue? Try a Map
Geographic Information Systems Are Tools to See Data on a Map

Climate change is creating uncertainty. Decisions on everything from trip planning, given unusual and extreme weather patterns, to how to reduce personal carbon emissions, are complex. Just consider choices around how people travel. Biking is a sustainable yet requires decisions about safe routes. Electric vehicles have fewer emissions than gas vehicles but require planning around charging stations.
As we head into summer, people are balancing the memory of last year’s forest fires with National Oceanic and Atmospheric Administration (NOAA) predictions of unprecedented numbers of hurricanes and daily reports of extreme heat and heat domes. Should you go on that trip? Or, is the risk of extreme weather and poor air quality too high? The decision fatigue is real.
Good news. There is a technology that can help us make complex decisions. And chances are you used it today. Modern digital maps, often called GIS (the nickname for Geographic Information Systems), fuel technology like Google Maps and Amazon delivery. GIS is also used to predict weather and climate patterns. A key tool in managing the impact of climate change, GIS informs related management decisions, such as hazard evacuation protocol, optimal deployment of forest fire fighters, and prediction droughts in food insecurity places like Africa.
As society aims to mitigate climate change and its impacts, maps are key to helping maneuver amid uncertainty and complexity. Maps are powerful because they use location as a universal way to index data, allowing simultaneous consideration of the earth, atmosphere, people, politics, economics, and health.
The power of GIS maps was clear during the COVID-19 pandemic when they became a critical tool for decision-making. The COVID-19 dashboard produced by Johns Hopkins University is one of the most viewed maps in history, with over 1 trillion views. Public health agencies across the world implemented COVID-19 dashboards, helping individuals make decisions about going to the store or on a trip, while also supporting public health policy.
Artificial intelligence (AI) is evolving maps further, enabling us to make decisions that consider the future. AI uses past patterns to predict future patterns. Since maps are representations of patterns across space, they can be infused with AI to map likely futures. Beyond weather prediction, maps of the future can help predictbiodiversity loss, species migration given climate change, or communities susceptible to sea level rise, and are being used at a broader scale to set policies that can help protect species and communities.
The next phase of AI-infused maps will help people design desired futures. It is possible to map the impact of possible decisions, ideally before change is implemented. Maps that help design the future are already being used by initiatives like 30×30, a global effort to designate 30 percent of Earth’s lands and oceans as protected by 2030. Using GIS, decision makers consider the future consequences and tradeoffs of conserving one location over another. Which plant and animal species will benefit most? What locations create the most connectivity in preserved lands? What human communities will have better access to nature? All of these questions can be asked and answered with GIS.
Even the best maps don’t have all the answers. Maps of the future are built on what is observed and known about processes in our world to date. They can guide action now. Maps can help people optimize solutions and aid identification of gaps in knowledge needed to improve decision making.
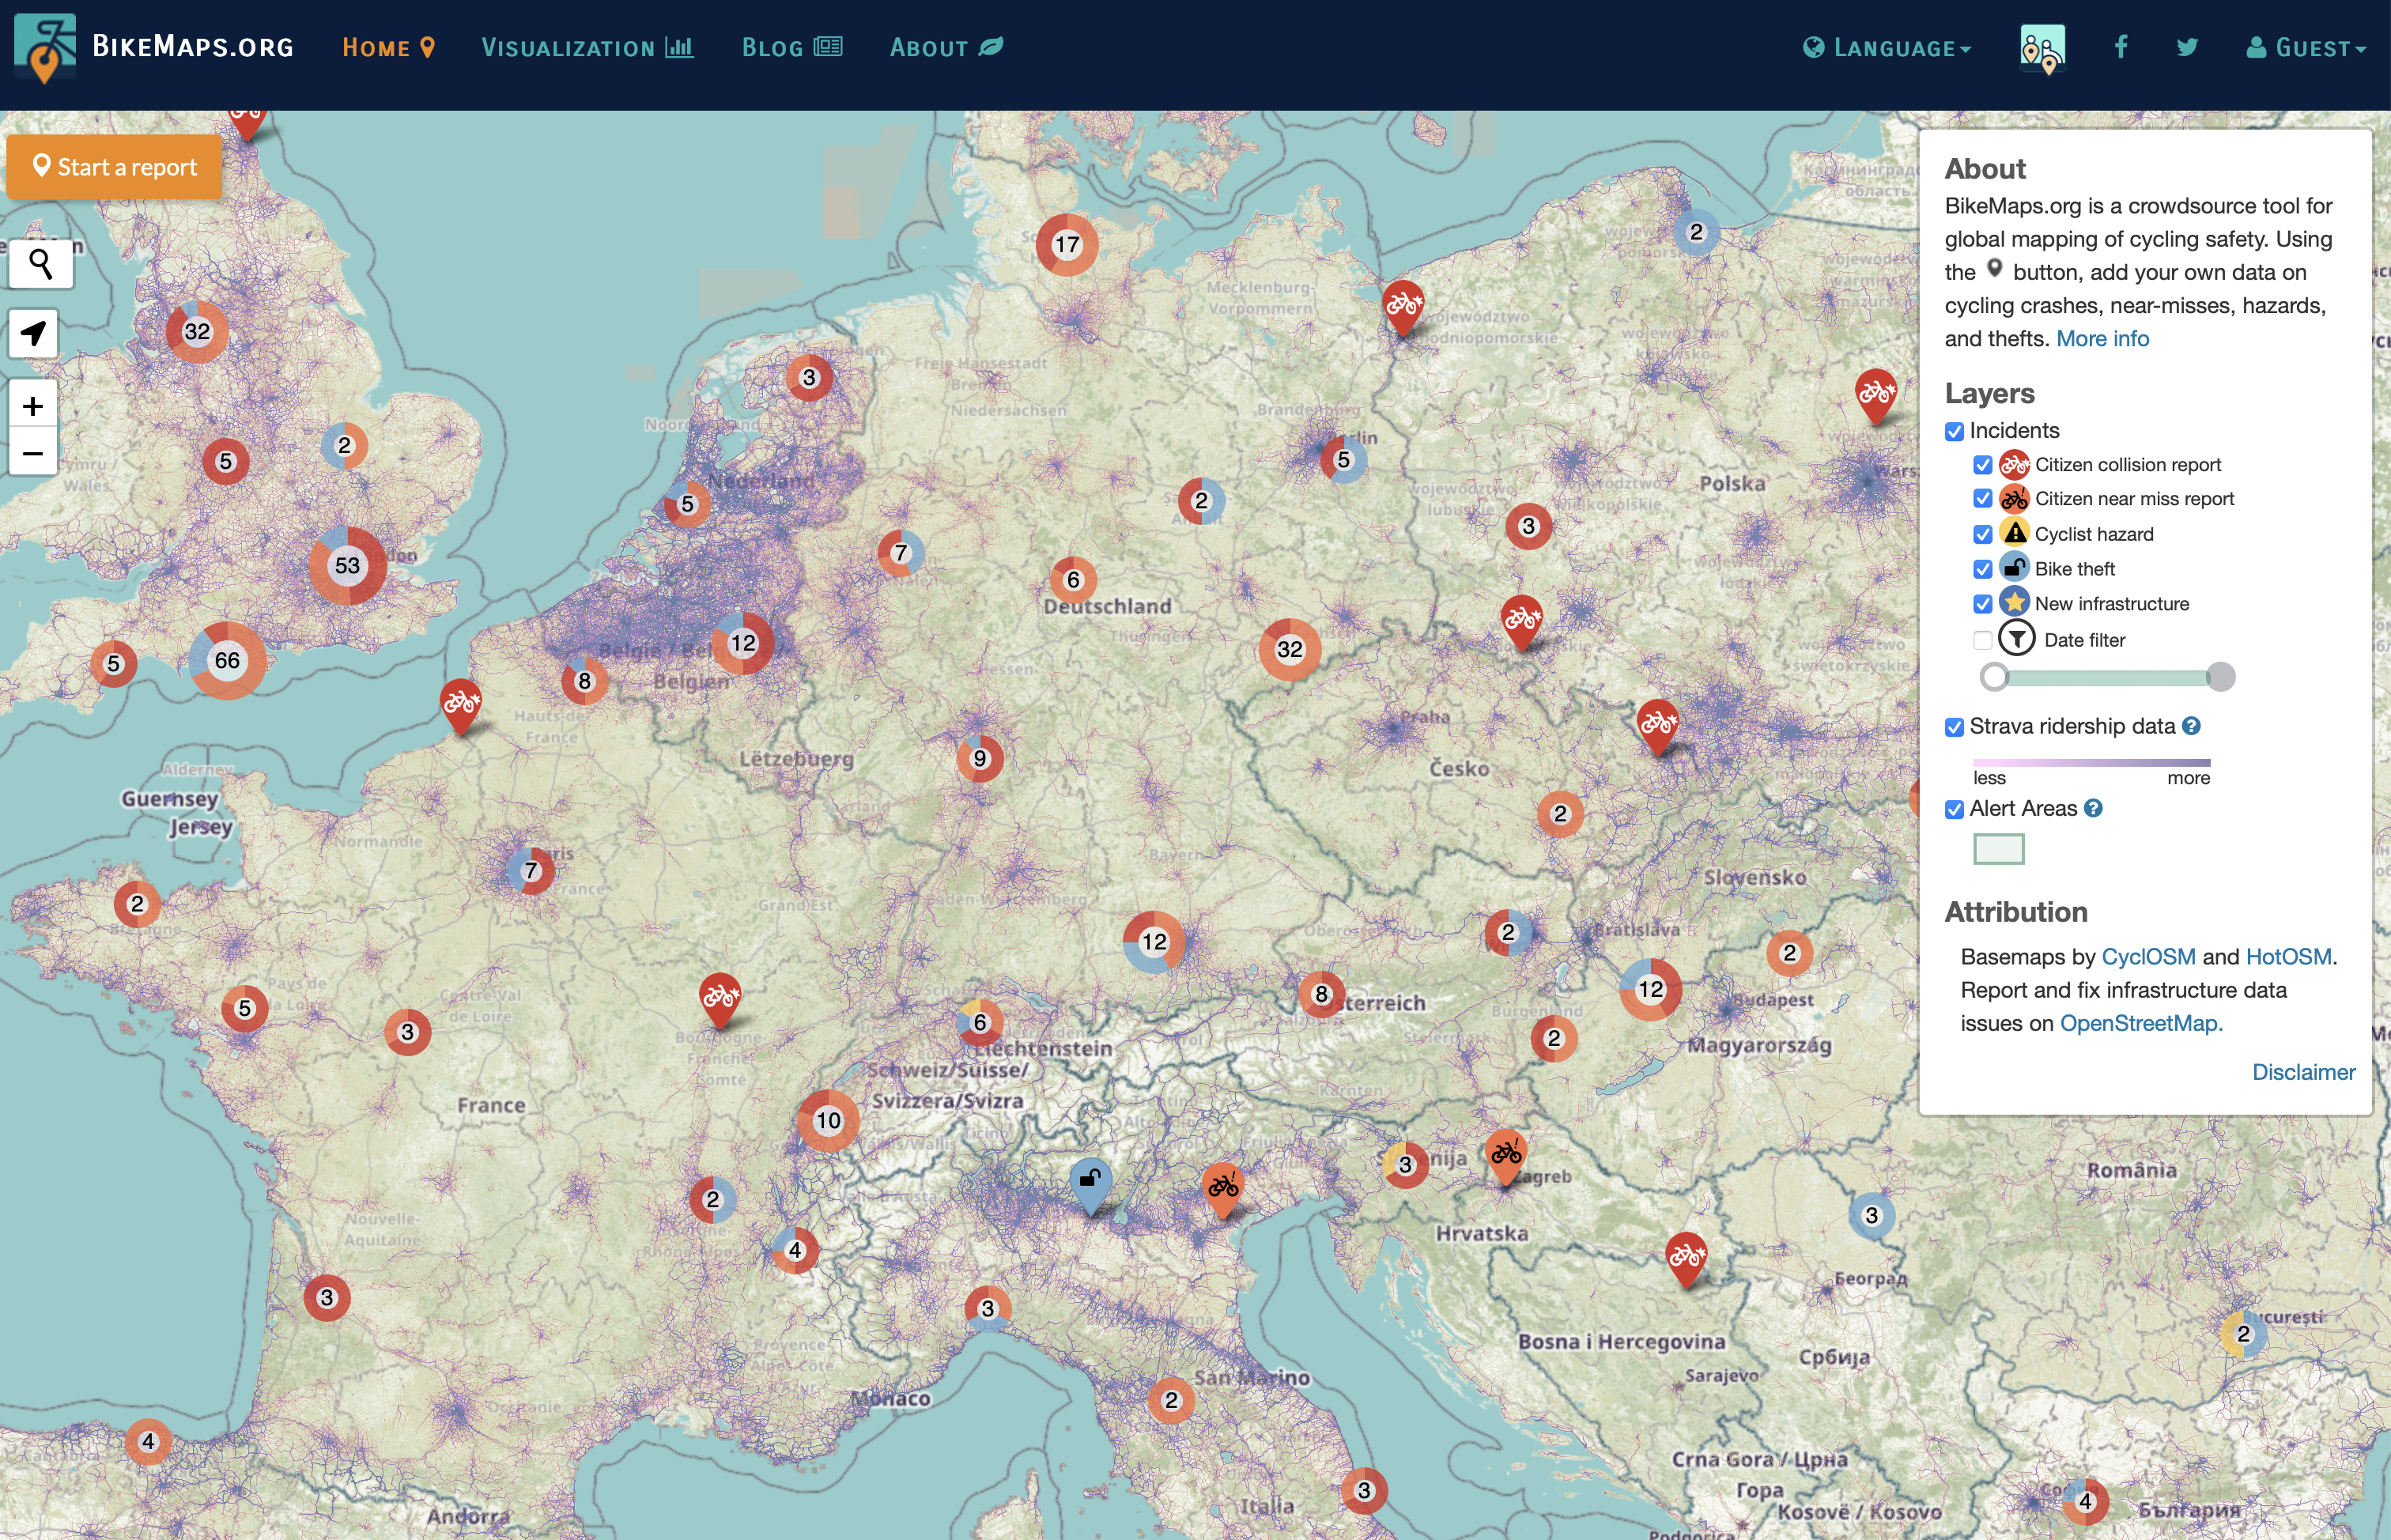
We are all tasked with making decisions. Some personal and some professional. Maps can help us understand and visualize the complexity of the impacts of our decisions, which is especially critical as people navigate climate change. Next time you are struggling with a decision, climate related or otherwise, consider if a map might help. BikeMaps.org is a map that I use to select safe routes for biking, and a growing number of EV charging maps make planning your electric transportation easier. You never know, there just might even be a map that is designed to help you make a decision you are wrestling with.
Professor Trisalyn Nelson is the Jack and Laura Dangermond chair of geography at the University of California Santa Barbara. She is also director of the Center for Spatial Studies and Data Science, and is a Public Voices Fellow of The OpEd Project.